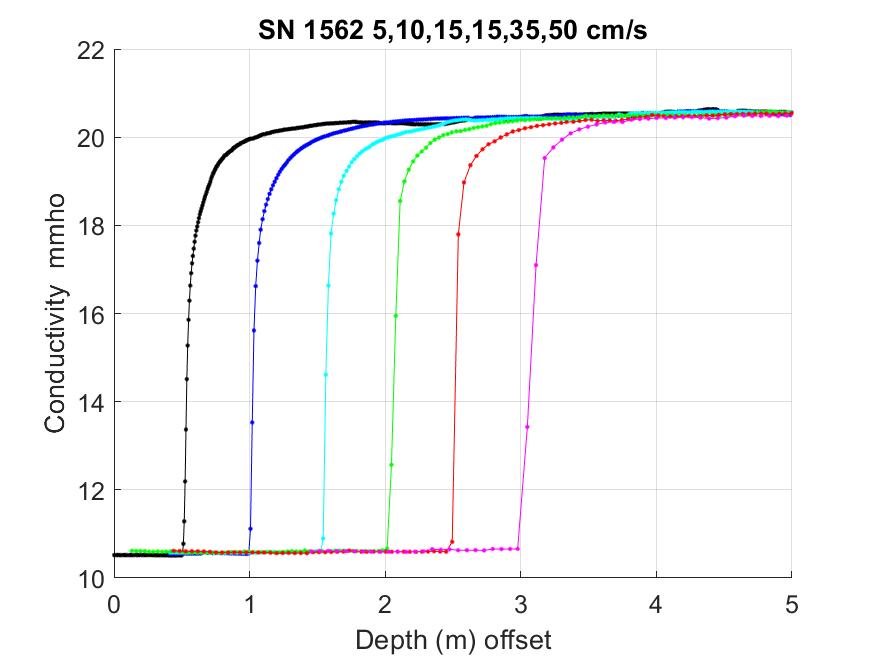
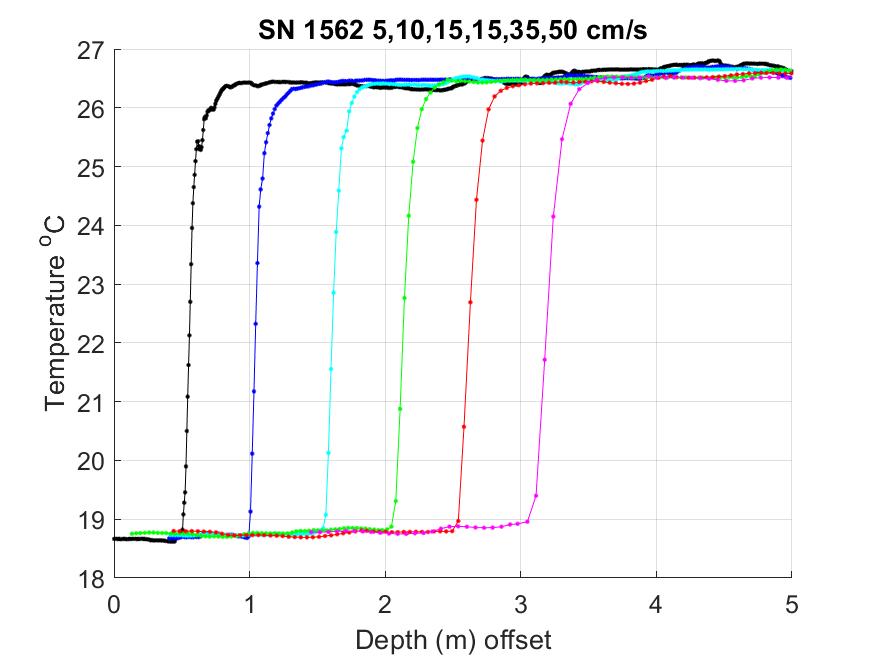
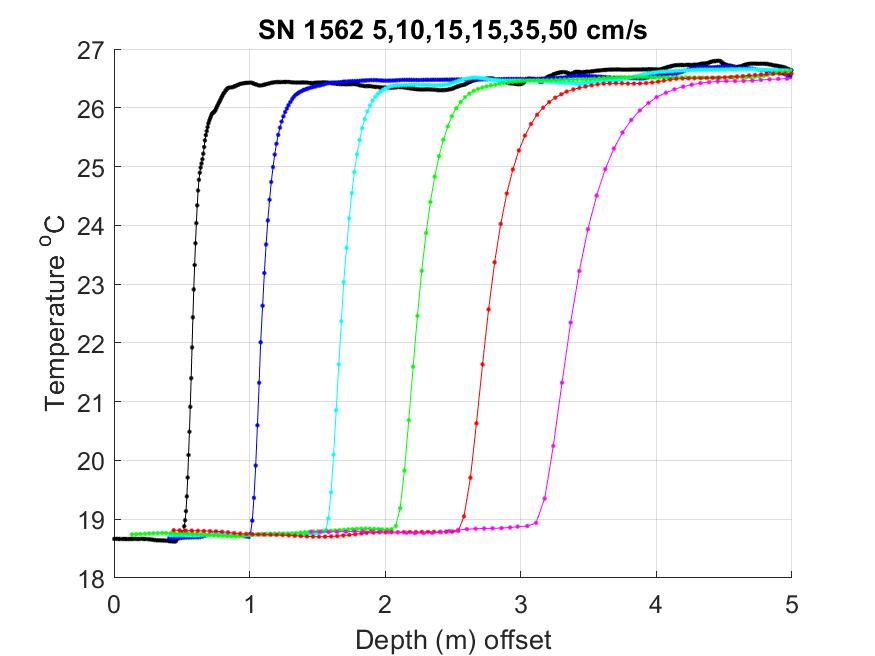
These are plots made by Dr. John Toole, Sc.D, from Woods Hole Oceanographic Institution.
The Plots below show profiles of t (temperature), c (conductivity) and lag-corrected t versus depth over the range of lowering speeds. Each curve is offset from the last – the progression goes from 5 cm/s to 50 cm/s (left to right).
For More information on the D-2 Inc. CTD for Ocean Conductivity Measurement please visit our product page or contact us directly: