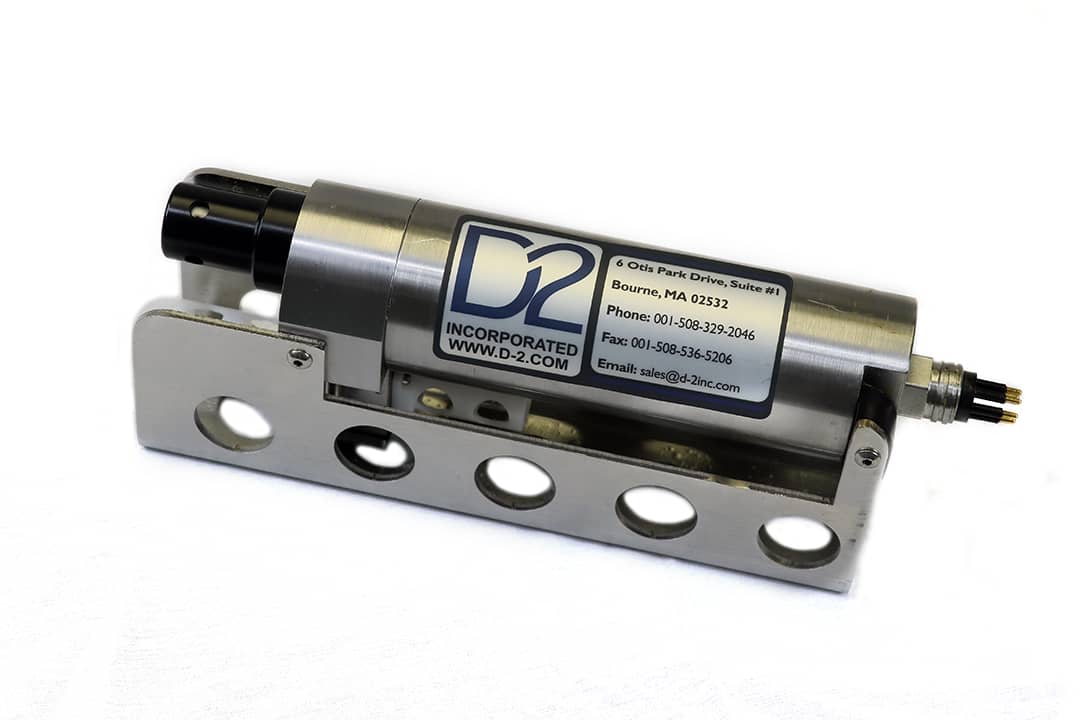
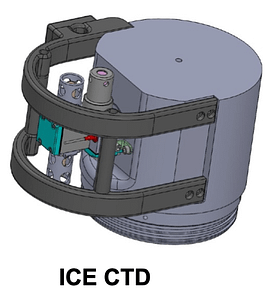
This is the D-2 Inc. Hybrid Conductivity, Temperature, Depth CTD Sensor. We have built two versions of the technology. One capable of full ocean depth, another that will deploy in the Arctic on an under-ice profiler. Our CTD cell, a U.S. patented technology, is the first new conductivity cell to enter the market in 30 years. This new conductivity sensor technology allows for smaller lightweight design. Improved precision and free flushing of the sensor (no pump required). The sensor has full ocean depth precision and resolution of .001 mS/cm.
Recent evaluation of this technology that evolved under a joint NOPP grant involving laboratory work and piggy-back ocean deployments. The initial deep ocean observations under this program documented a small drift in measured conductivity over time (Fougere et al., Oceans 2021 doi: 10.23919/OCEANS44145.2021.9706077). The diagnosis to be because of degradation of the annular electrodes in the cell. The electrodes redesign and subsequent deep ocean observations suggest it has rectified the drift problem.
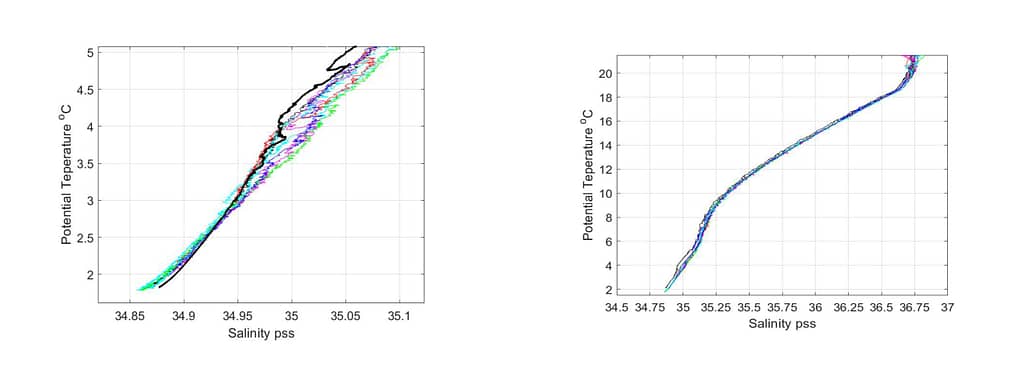
CTD Ocean Data Results...
Currently, data are being collected with the new cell design by researchers from Bermuda Institute for Ocean Sciences (BIOS) in partnership with scientists at Woods Hole Oceanographic Institution (WHOI). These data show that the D-2 Inc. CTD gets data comparable to the operational sensors now being fielded by the ocean observing community. The figures above show potential temperature-salinity data (full depth span right, expanded abyssal view left) got on casts spanning Dec 6, 2022 to Feb 5, 2023. To date, they got 64 casts of varying depth. They constructed the figures above with just the deep stations. The black curve in the left panel is from the BIOS ship-based CTD system, shown for reference.
CTD Lab Data Results
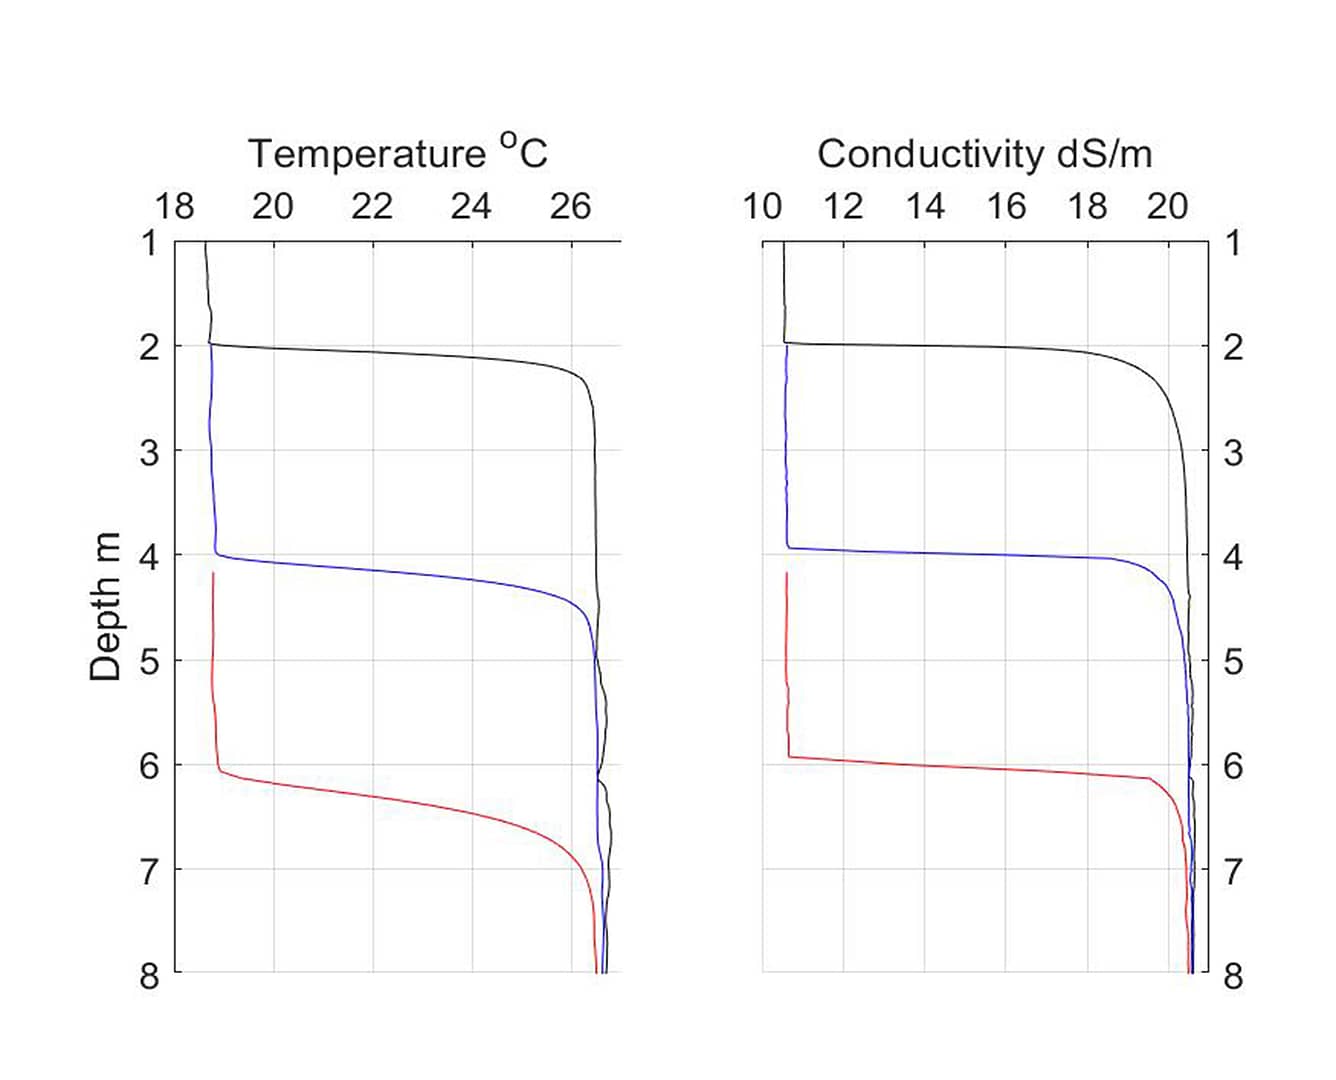
Besides deep ocean observations, assessment of response characteristics of the D-2 Hybrid CTD by lowering sensors at various rates in WHOI’s response tank facility. They stratified the tank with cooler, fresher water overlying warmer, saltier water–double diffusive convection maintains a sharp interface between the layers. They lowered hybrid CTDs through the interface at several speeds to characterize the transient response of the instrument.
The above figure shows vertical profiles of temperature (T), conductivity (C) and salinity (S) at profile speeds of 10 (black), 25 (blue) and 50 (red) cm/s. ~2 m have successively offset the 25 and 50 cm/s curves for clarity. From these data, they judge the T probe to have a response time of around 0.5 s, which is quite typical for standard CTD sensors. The conductivity data shows an abrupt jump at the top of the interface with a more rounded drift into the lower layer conductivity. The latter may manifest reduced flow in the fluid boundary layer within the cell and/or a small thermal mass effect. After response correction, the resulting salinity data shows a rapid transition through the interface with no spiking.